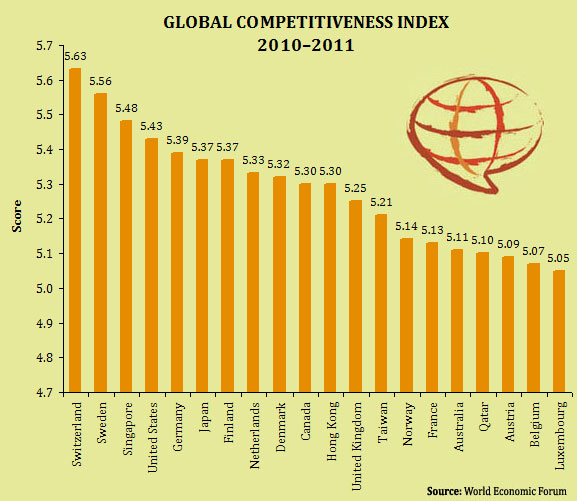
And the winner is…: Switzerland (again)
In the new release of the Global Competitiveness Report 2010 countries that constitute the top 10 of the Global Competitiveness Index (GCI) remain the same as last year, with some changes in rank among them.
Switzerland remains first: retains its 1st place position again this year as a result of its continuing strong performance across the board. The country’s most notable strengths are related to innovation, technological readiness, and labor market efficiency, where it tops the GCI rankings. Switzerland’s scientific research institutions are among the world’s best, and the strong collaboration between its academic and business sectors, combined with high company spending on R&D, ensures that much of this research is translated into marketable products and processes that are reinforced by strong intellectual property protection.
United States in decline: the United States continues the decline that began last year, falling two more places to 4th position. While many structural features that make its economy extremely productive, a number of escalating weaknesses have lowered the US ranking over the past two years. The evaluation of institutions has continued to decline, falling from 34th to 40th this year. The report states that the public does not demonstrate strong trust of politicians (54th), and the business community remains concerned about the government’s ability to maintain arms-length relationships with the private sector (55th) and considers that the government spends its resources relatively wastefully (68th).
Reinforced China: Up two positions to 27th place, China has reinforced its position within the top 30. It is the only BRIC country to improve in the rankings this year, thus increasing the gap with the other three. China’s performance remains stable in most areas measured with the Index compared with last year, with its main strengths its large and growing market size, macroeconomic stability, and relatively sophisticated and innovative businesses.
Stable Chile: Stable at 30th, Chile remains the most competitive country in Latin America and the Caribbean, with a very convincing performance resting notably on solid basic requirements (37th) and efficiency enhancers (35th). The country has been at the forefront of market liberalization and opening, resulting in very efficient goods and labor markets (28th and 44th, respectively), one of the most sophisticated financial markets (41st), and the largest pension industry in the region.
Argentina still in the bottom: Argentina is fairly stable at 87th, continuing to feature in the bottom part of the rankings. The picture is rather mixed: important strengths, such as its extensive market size (24th) and fairly good educational system at the primary and higher levels (ranked 60th and 55th for health and primary education and higher education and training, respectively), do not seem to compensate for the serious and enduring shortcomings undermining Argentina’s long-term growth potential.
Here comes Qatar: Qatar, ranked 17th, enters the top 20 this year and reaffirms its position as the most competitive country in the region. With a projected growth rate of 18.5 percent for 2010, the country is the fastest-growing economy in the world, as well as one of the wealthiest. Its strong competitiveness rests on solid foundations made up of a high-quality institutional framework, ranked 10th overall, a stable macroeconomic environment (8th), and an efficient goods market (12th). Low levels of corruption and undue influence on government decisions, high government efficiency, and excellent security are the cornerstones of the country’s solid institutional framework.
What does competitiveness stand for?
According to the authors competitiveness is the “set of institutions, policies, and factors that determine the level of productivity of a country. The level of productivity, in turn, sets the sustainable level of prosperity that can be earned by an economy. In other words, more competitive economies tend to be able to produce higher levels of income for their citizens. The productivity level also determines the rates of return obtained by investments (physical, human, and technological) in an economy.”
Developing economies: the major engine of the global economy
The 12 pillars of competitiveness
The best way for Rwanda to improve its competitiveness is not the same as the best way for Germany to do so. This is because Rwanda and Germany are in different stages of development: as countries move along the development path, wages tend to increase and, in order to sustain this higher income, labor productivity must improve.
The GCI assumes that, in the first stage, the economy is factor-driven and countries compete based on their factor endowments: primarily unskilled labor and natural resources. Here is when the first 4 pillars (grouped under the category Basic requirements) play a role within what is been called factor-driven economies.
Factor-driven economies: basic requirements• Institutions• Health and primary education• Macroeconomic environment• Infrastructure
According to the authors’ approach, as a country becomes more competitive, productivity will increase and wages will rise with advancing development. Countries will then move into the efficiency-driven stage of development, when they must begin to develop more efficient production processes and increase product quality because wages have risen and they cannot increase prices. At this point, competitiveness is increasingly driven by what’s been called efficiency enhancers.
Efficiency-driven economies: efficiency enhancers• Higher education and training• Goods market efficiency• Labor market efficiency• Financial market development• Technological readiness• Market size
Innovation-driven economies: innovation and sophistication factors• Business sophistication• Innovation
Where does the data come from?
The 2010 editionIn the edition of 2010 it has also expanded the scope of its sample, achieving this year a record of over 15,000 surveys from 139 economies between January and May 2010.


